Point estimation
Mean and variance
- Assume that some characteristics of elements can be represented by random variable X whose pdf is fx(x,titer)
Choose the varables for our parameters, this will give us different normal distribution
The form of pdf is assumed know except that it contains unknown parameter titer
Parameter is just some constant for our PDF
- Estimator: Based as a fomula on the random sample -> Can use to estimate the unknown parameter
Estimation
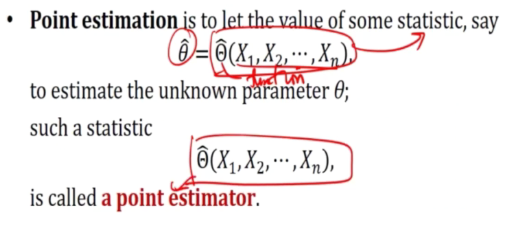
- Point estimation
This will be always wrong, but it is good for a large sample size (Law of large number)
- Interval estimation
Choose an interval where the unknown can land in.
e.g Avg temperature in singapore: 28 - 30 degrees
Parameter and statistic
A statistic is a function of the random sample which does not depend on any unknown parameters
We can only vary the random set but we cannot involve anything that is not known to us, it cannot be use as an estimator
Point estimate of mean
Suppose u is the population mean
- The stats that one uses to obtain a pount estimate is called estimator
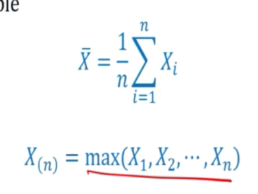
e.g Xspa is an estimator of u
The value of X, denoted by xspa is an estimate of u
E.g 1
- Sample mean of random sample taken from population with mean u is 5
-
Point estimate for the population mean u is 5
- lowercase: estimate
- Uppercase: Estimator
Different random sample give different point estimates of u
Interval estimation
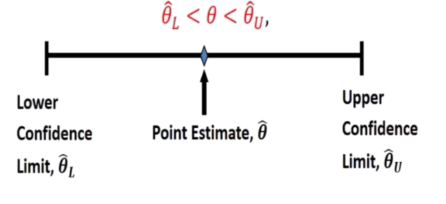
- Define two stats like:
This is a random interval per 2 end points where each end point is a random variable.
E.g 2
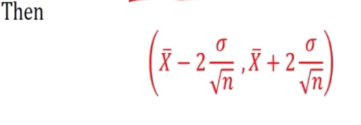
Suppose a^2 is known
Let
Random variable has more than one variable with a probability associated with it.
Unknown parameters are unknown constant that will not change
Here we use xspa to determine the estimate. If we want to find the chance where
p(titleL < u < titleU) ?
Unbiased estimator
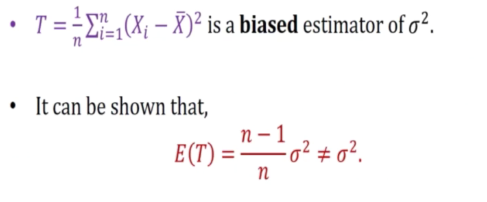
- A statistic is said to be an unbaised of the parameter titer if
E(x) = u and E(xspa) = u
This is a consistent estimator where n is very huge
To compare two different estimator for same parameter, we look at the unbiasness.
Estimator is good if:
- Biase is small (Not too far from para)
- Variation is not very big
This is called mean square error
Interval estimation
- An interval estimate of population parameter is an interval of the form
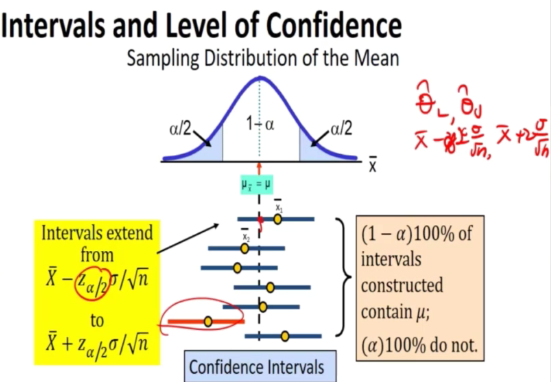
We try to get the width of confidence interval small.
-
Since different sample will yeild different titer hat
-
Therefore, these end points of the interval are values of corresponding random variables
I take a sample and calculate many intervals. Titerlhat can be consider as a random variable.
If we repeat it many times, about 95 percent of the time, it will cover
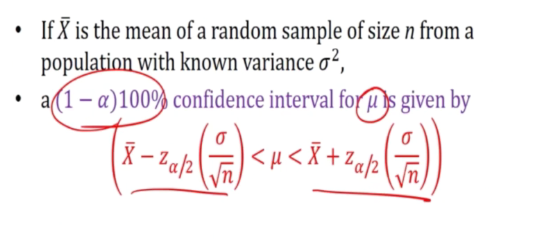
Confidence interval for the mean
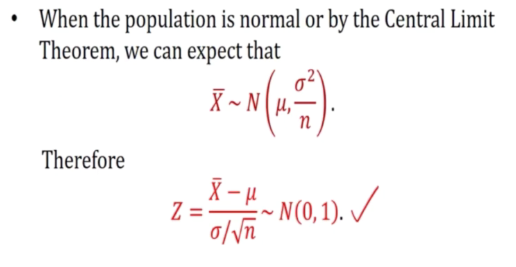
Known variance case
Confidence interval for mean with
- Known variance case
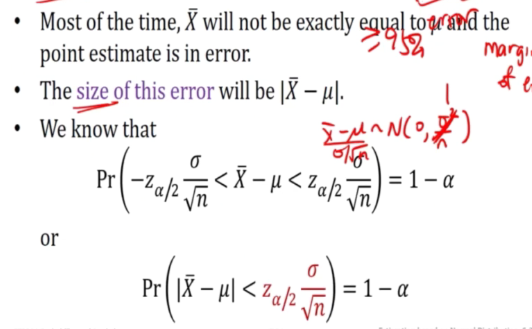
Sample size for estimating mean
How big the sample must i get in order to get inference? -> Depends
This is to get the sample size
- If e is small, then n will be big.
- if n is big, e will be big
This is the same as saying that if the variance is big, we need a larger sample size in order to achieve a higher level of confidence
E.g 1
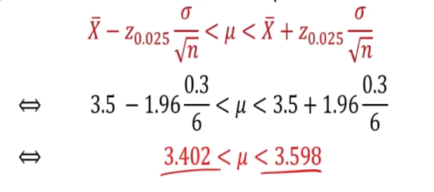
- Mean of CAP of random sample of 36 seniors is 3.5
- muel is 0.3 i) find the confidence interval for the mean of the entire seniors
We can just sub in the fomula
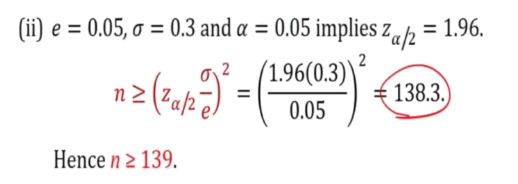
ii) How large a sample is required if we want to be 95 percent confidence that our estimate of u is off by less than 0.05?
Unknown Variance case
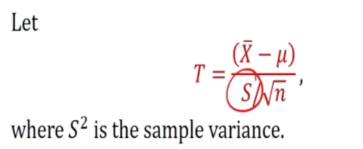
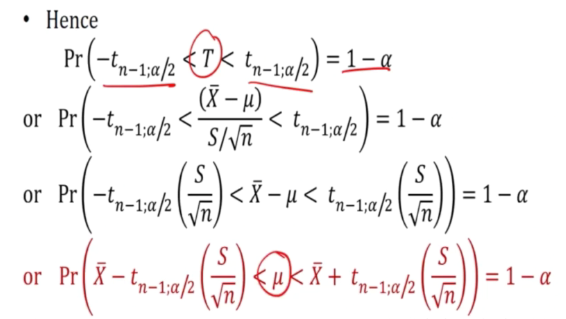
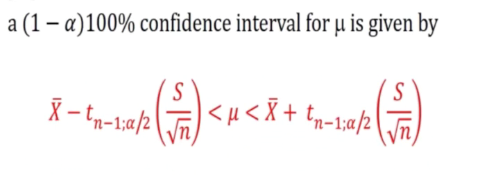
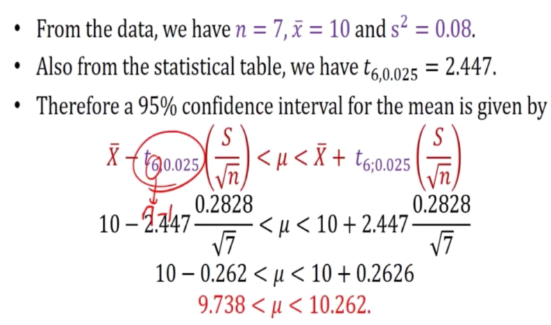
- We are thinking of small sample size (n<30)
- Point estimate
- Construct an interval: some multiple of the sd
For large n,
E.g 1
E.g 2
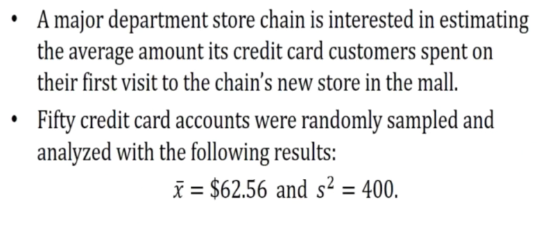
- The population is the customers that uses credit card
- u, the avf amount spent on their first visit to the chain’s new store in the mall
We are interested in certain characteristic of the individual which is the amount spent
-> We assume that they follow a normal distribution
- Since n is large, we use z value instead of t-value
A 90 percent confidence interval for the mean is given by:
Confidence intervals for the difference between two means
We normally like to look at the difference. It does not matter which mean is one or two, we can swap accordingly
- Assume have 2 population with u1 and u2 and varaince a1 and a2
Then
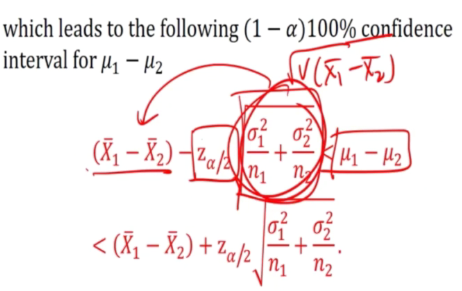
Xspa1 - Xspa2
is the point estimator of u1 - u2
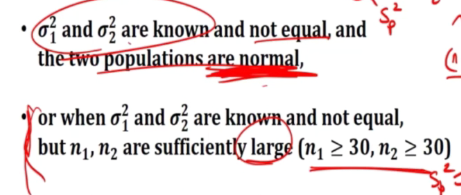
Known variances
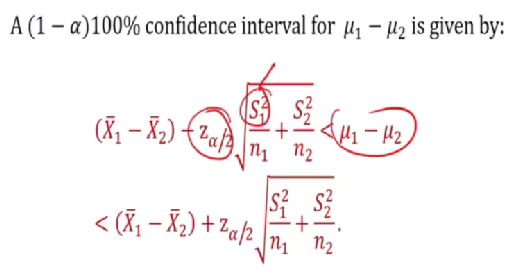
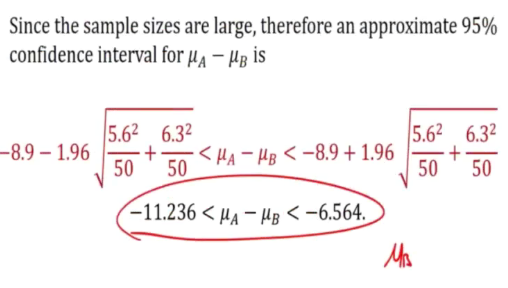
Large Sample C.L for unknwon variance

We use s1^2 because we trying to use the best known
E.g 2
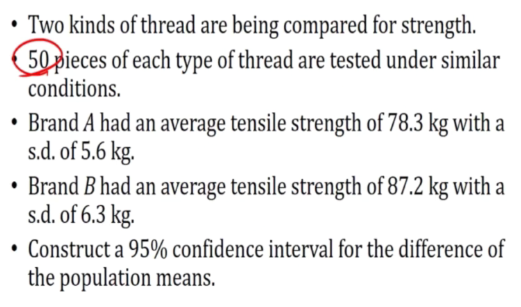
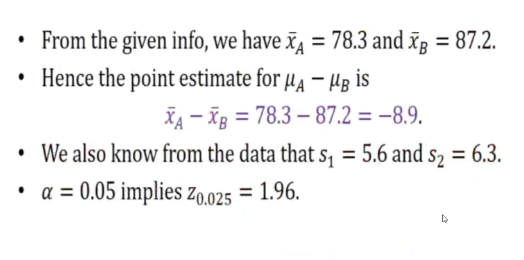
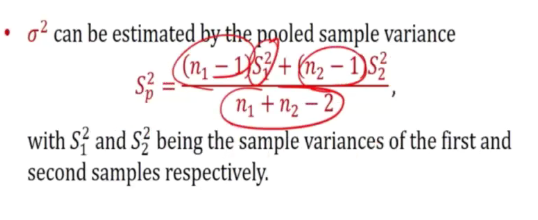
Unknown but equal variances
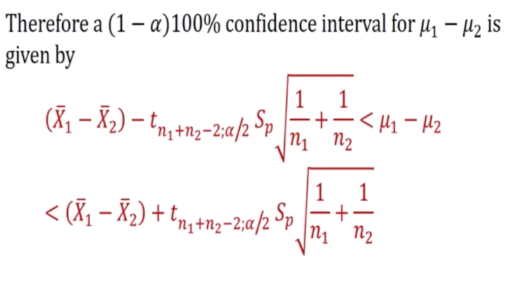
We can still apply the t distribution
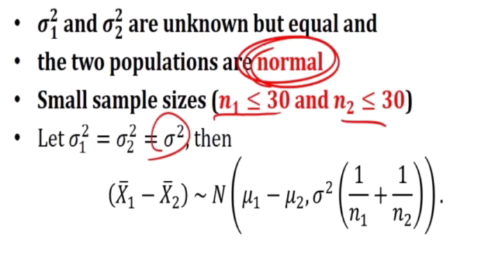
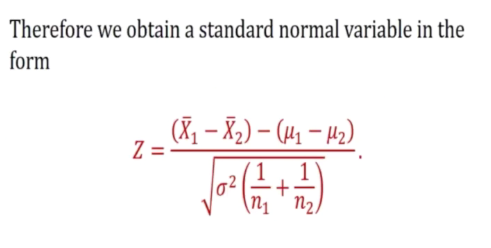
We can use chi - square (they are independent)
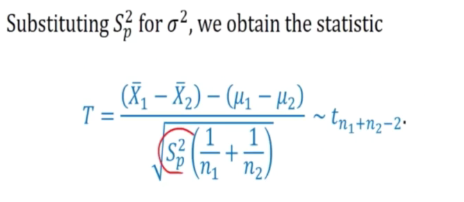
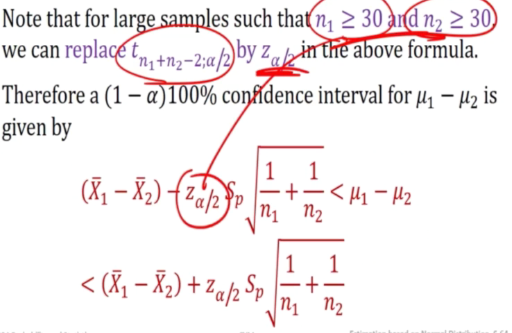
Unknown but equal variance for large sample
Just check these conditions:
1) Approximately normal 2) Equal variance
This will give us a range for u1 - u2
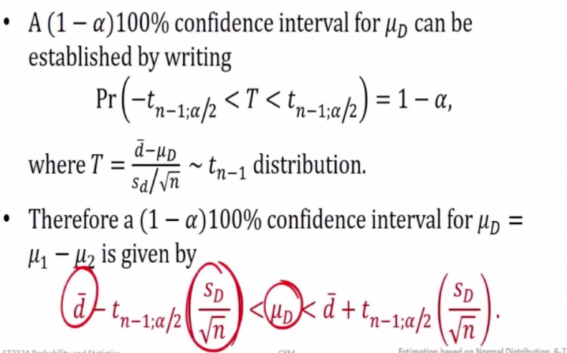
C.L for the difference between two means for paired data (Dependent data)
We want to find out if there are difference in the means but what we are looking for if there are difference in the two variables.
How to find the confidence interval for this difference
We are trying to find the avg of these two differenes.
1) Consider before and after
2) Both u is taken from the same individual (pair)
3)
Consider these questions:
- Normally distributed? => yes
- Do we know the variance (population)? => no
we are looking at d + k sqrt(
- Sample size is known => yes
V(xspa) = a^2/n
the xi and yi is related
Big sample does not mean that the sample follow the normal distribution!!!!!! It is the average (xspa) which follow normal distribution if our sample size is big enough, central limit theorem only apply to xspa
Small sample and approximate normal population
For large sample (n>30)
The numbers are close to 1.96, therefore we can just replace it.
E.g 4
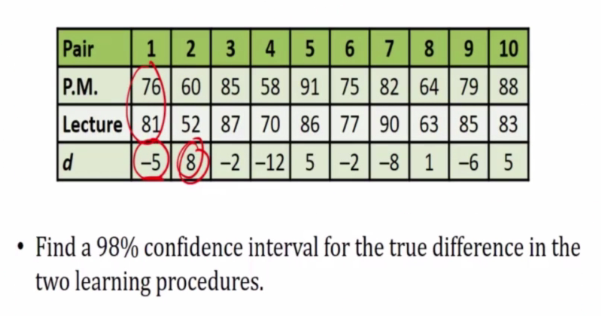
- 10 pairs of 20 students
- Each member of pair is approx the same IQ
- One of each pair was selected at random and is assign to a math section using program materials only
- The other member of each pair is assign to professor lecture
- Given same exam there result recorded
d is x-y
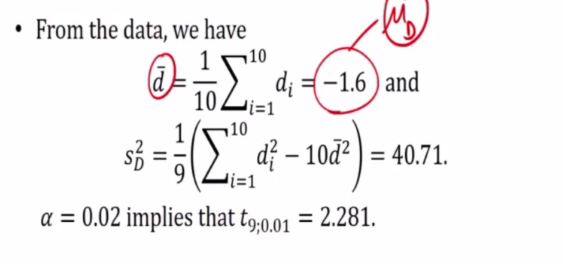
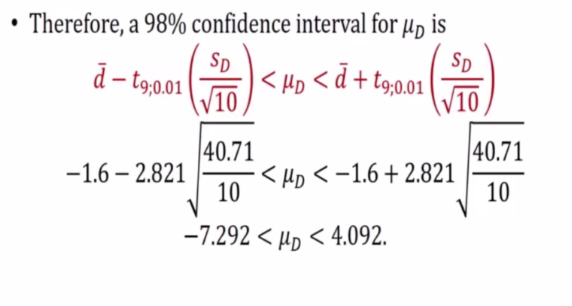
We can use this formula because the sample size is not big, in order to known, we assumed that the d follow a normal distribution.
This also means that x (p.m) and y (Lecture) are normally distributed, therefore d is also normally distributed
Confidence interval for variance and ratio of variance
This is sigma square and sigma1^2 / Signam2^2 square
Consider:
1) Normal distribution?
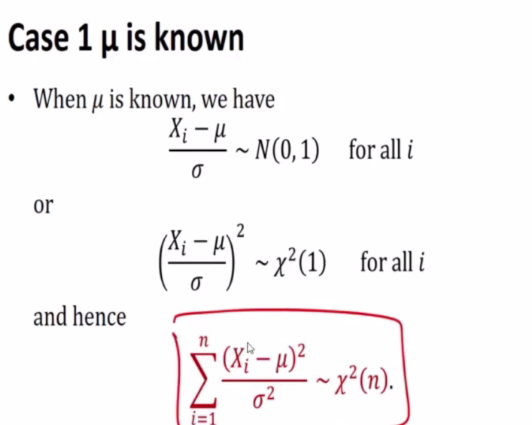
2) Parameters u is it known? => Yes
3) Large sample size?
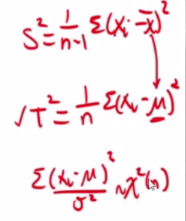
We replace the xpsa with u in the fomular of T^2 and S^2
If u is known, we should use it, xspa is an estimate. Choose the accurate one over the estimate.
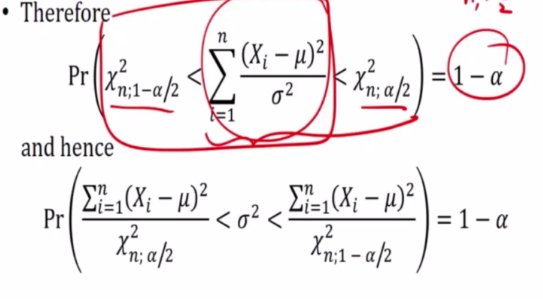
u is known
We are just doing chi square distribution.
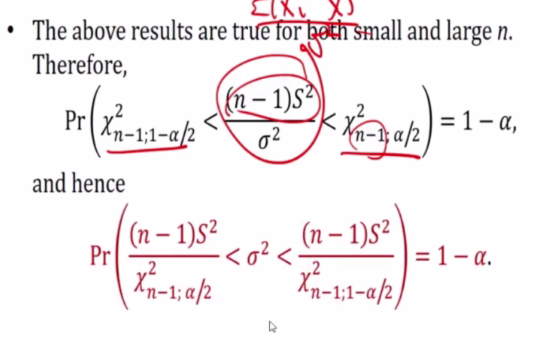
1-a confidence
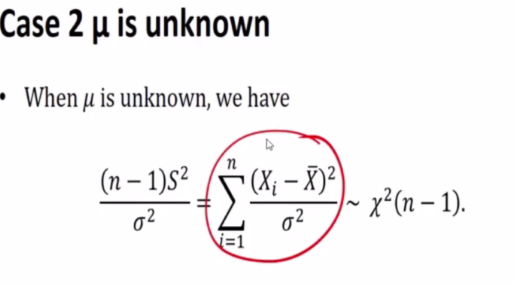
-> Get from chi square table
- Where s^2 is the sample varaince
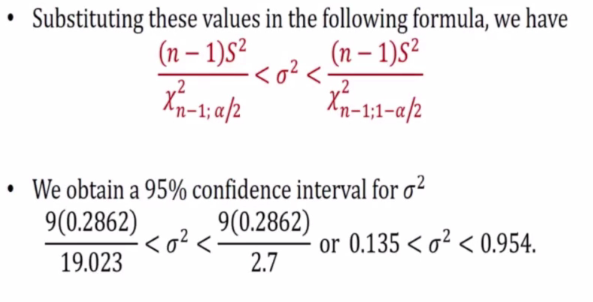
E.g 1
-
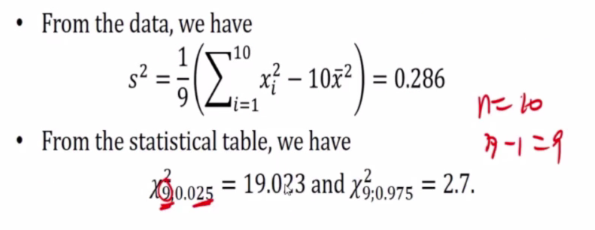
10 cans of peaches in volume are:
-
Assume x follow normal distribution
Because we do not know u, we will have to use another formula
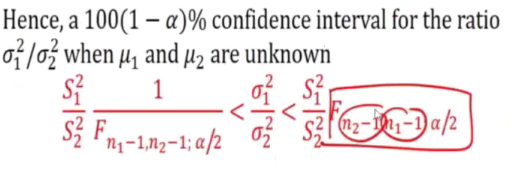
The ratio of two cariances with unknown means
1) normal => yes
2) u known? => No
3) sample size => this doesnt matter anymore
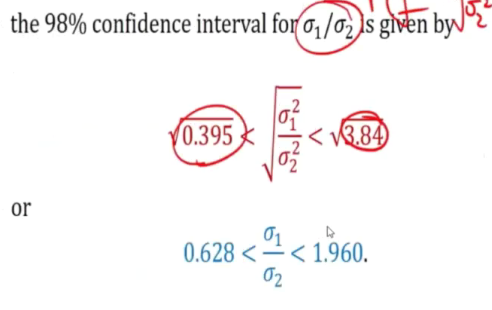
This is a ratio of two chi square distribution.
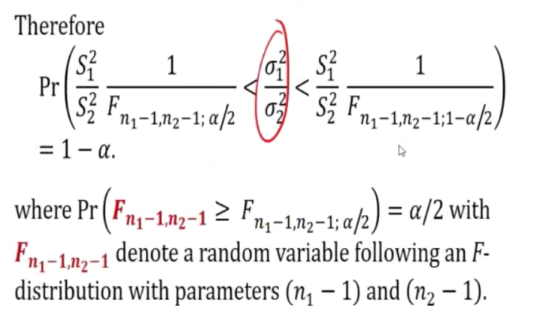
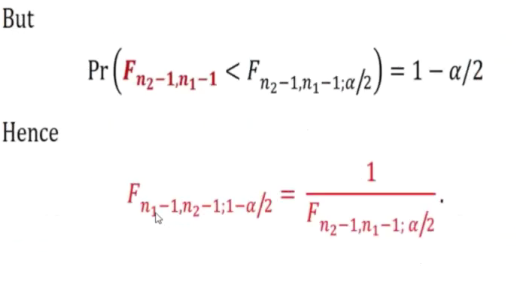
We can see we just swap the degrees of freedom
The reciprocol of F 2,4,0.95 => F 4,2,0.05
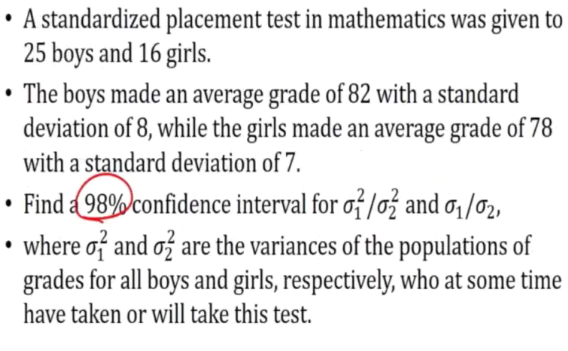
E.g 2
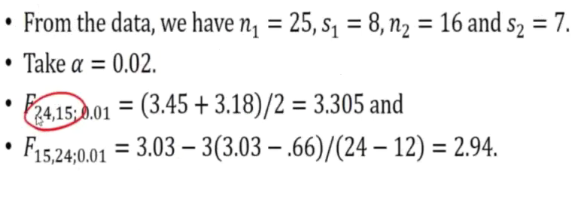
Sometimes we cannot get the exact value from the table, thus we need can get the average of the values that are closer to the one we want.
